|
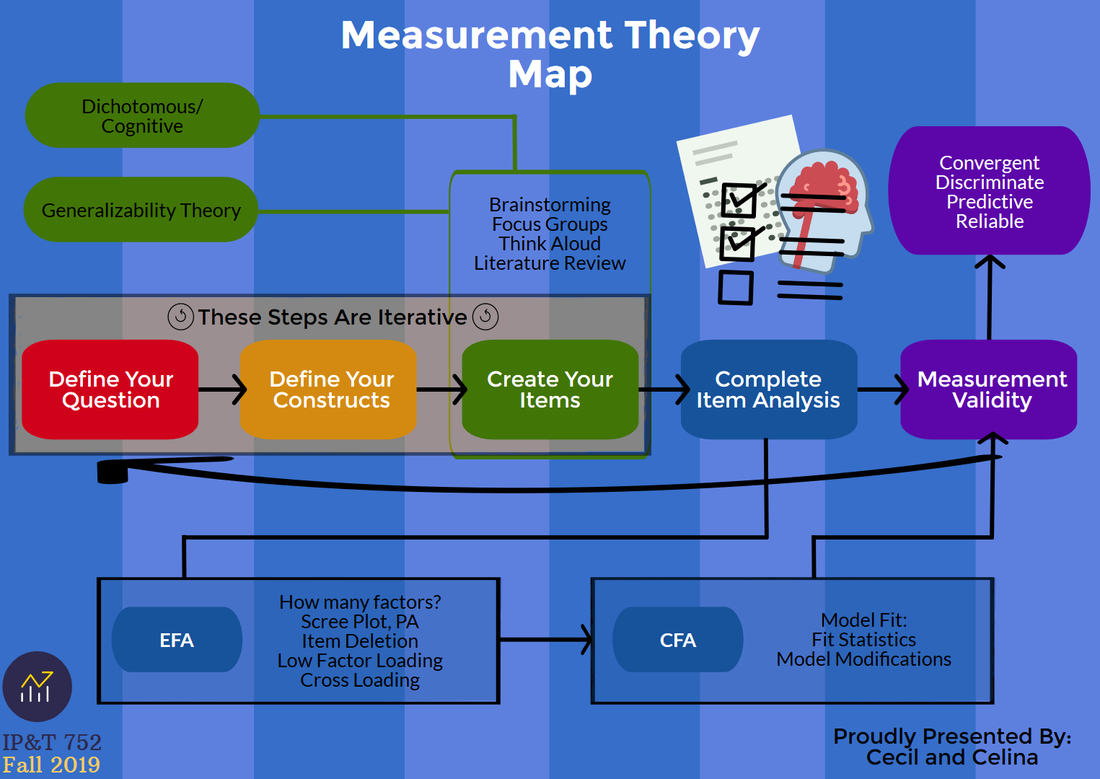
Last semester in my Measurement Theory class, we were given a challenge to take everything we had learned - basically the process of creating a measurement tool including: defining constructs, conducting EFAs, conducting CFAs, different reasons and ways to do so, etc. - and condense it all down to a single page. Knowing that there was maybe too much information to condense it to a single type-written page, I got a bit creative and created a single page using PiktoChart and H5P. After sharing it with the class, they helped me get more information for the graphic so it could be a fairly complete summary of the semester. Unfortunately the H5P account has expired so the interactive map is unavailable, but the static image is posted below for reference. Most of the information for the graphic can be found here.
The graphic is shared here for record keeping and for others to use as they see fit.
0 Comments
Your comment will be posted after it is approved.
Leave a Reply. |
About
This blog presents thoughts that Cecil has concerning current projects, as well as musings that he wants to get out for future projects. For questions or comments on his posts, please go to his Contact page. Archives
April 2024
Tags
All
|

 RSS Feed
